Power and sample size in a linear mixed model analysis of pre-/post- immunoassay data (RCT setup of MYSTERY-HF trial)
RCT
Power
Sample Size
Powering quantitative pre-/post- immunoassay data to test for superiority
Statistical considerations
Hypotheses
The null-hypothesis of no decrease in compound X comparing IMP to placebo will be tested versus the alternative hypothesis of a decrease in compound X in favor of IMP to placebo using a one-sided test at 5% level of significance.
Analysis populations
!TBD
Sample size
Power calculations for two-sample t-tests of means
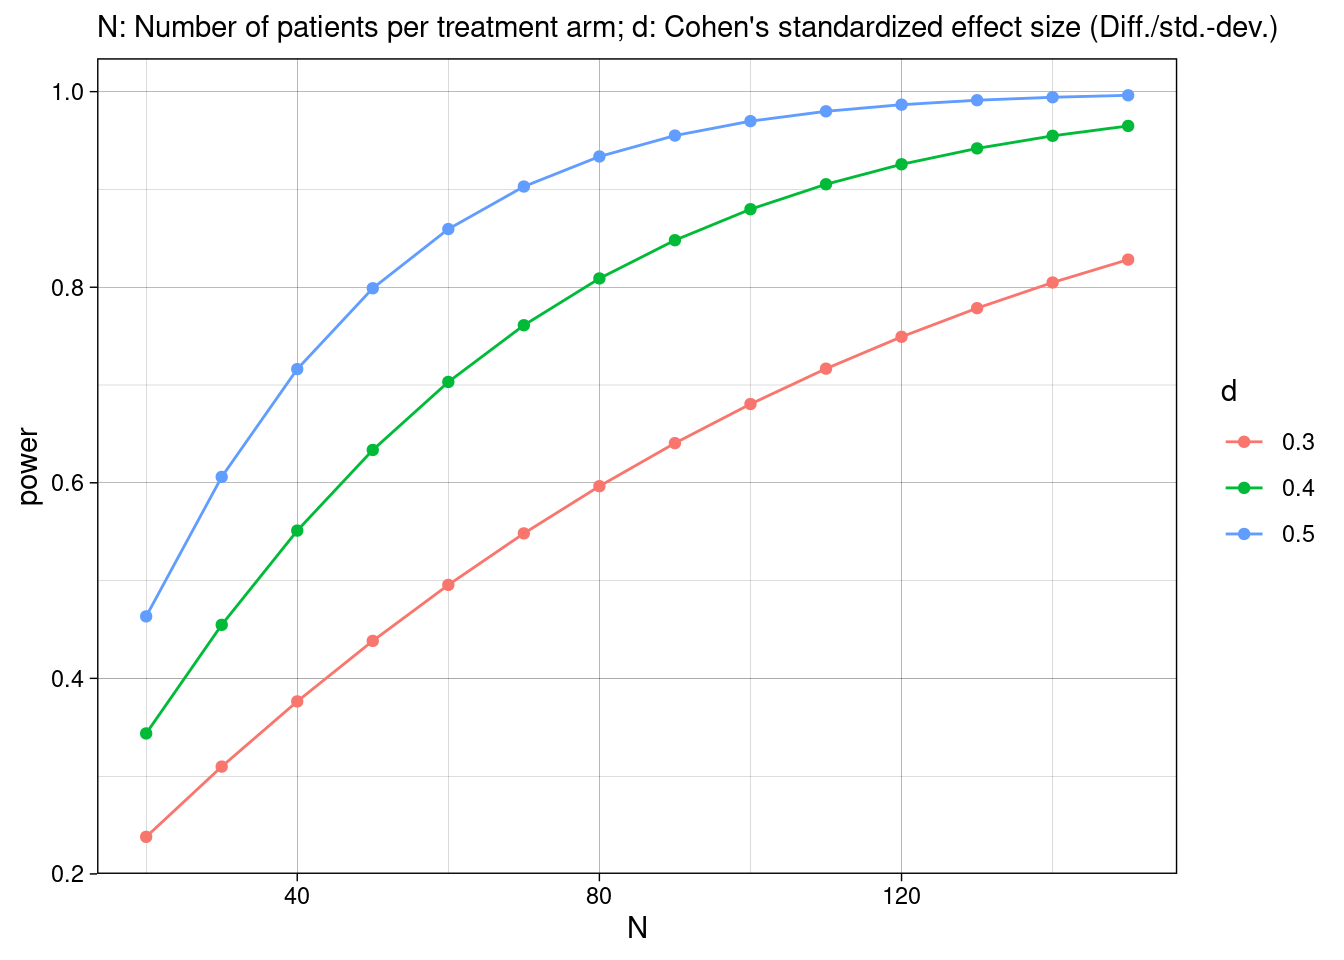
Figure 1 shows change in power with sample size according to assumed (standardized) effect size (i.e. Cohen’s ‘d’) in one-sided two-sample t-tests of means at alpha = 0.05.
The study has been powered to have at least 80% power to detect a 33% decrease in compound X level at 12 weeks relative to baseline for IMP treated versus placebo in a one-sided test at 5% level of significance. Under the assumption of a standard deviation of 0.8 for the change from baseline in log transformed compound X, and allowing for 10% missing values, 50 participants per arm would render the desired power.
Statistical methods
Primary endpoint
The main analysis for compound X will be using a mixed effects linear model with participant as random effect, treatment, visit, and treatment-by-visit interaction as fixed effects, and baseline as covariate, including all participants in the full analysis set. As the distribution of compound X is skewed and variability increases with value, data will be log-transformed before analyses, and results will be back-transformed to describe relative change versus placebo in value at end of treatment relative to baseline.
No multiplicity adjustment for alpha is planned. All personnel involved with the conduct of the study will remain blinded until database lock at 2 weeks and protocol violations have been identified and documented.
Secondary endpoints
Secondary endpoints will be analyzed descriptively and visualized over time. Additional analyses will be described in a statistical analysis plan (SAP) to be provided before databaser closure.
Handling of dropouts
To reach a total number of 112 patients completing the study (at least to visit 5), up to xy drop-outs will be replaced. However, estimates from mixed models will be analyzed also in terms of sensitivity for possible missing data.